MOSAIKS: A Generalizable and Accessible Approach to Machine Learning with Global Satellite Imagery

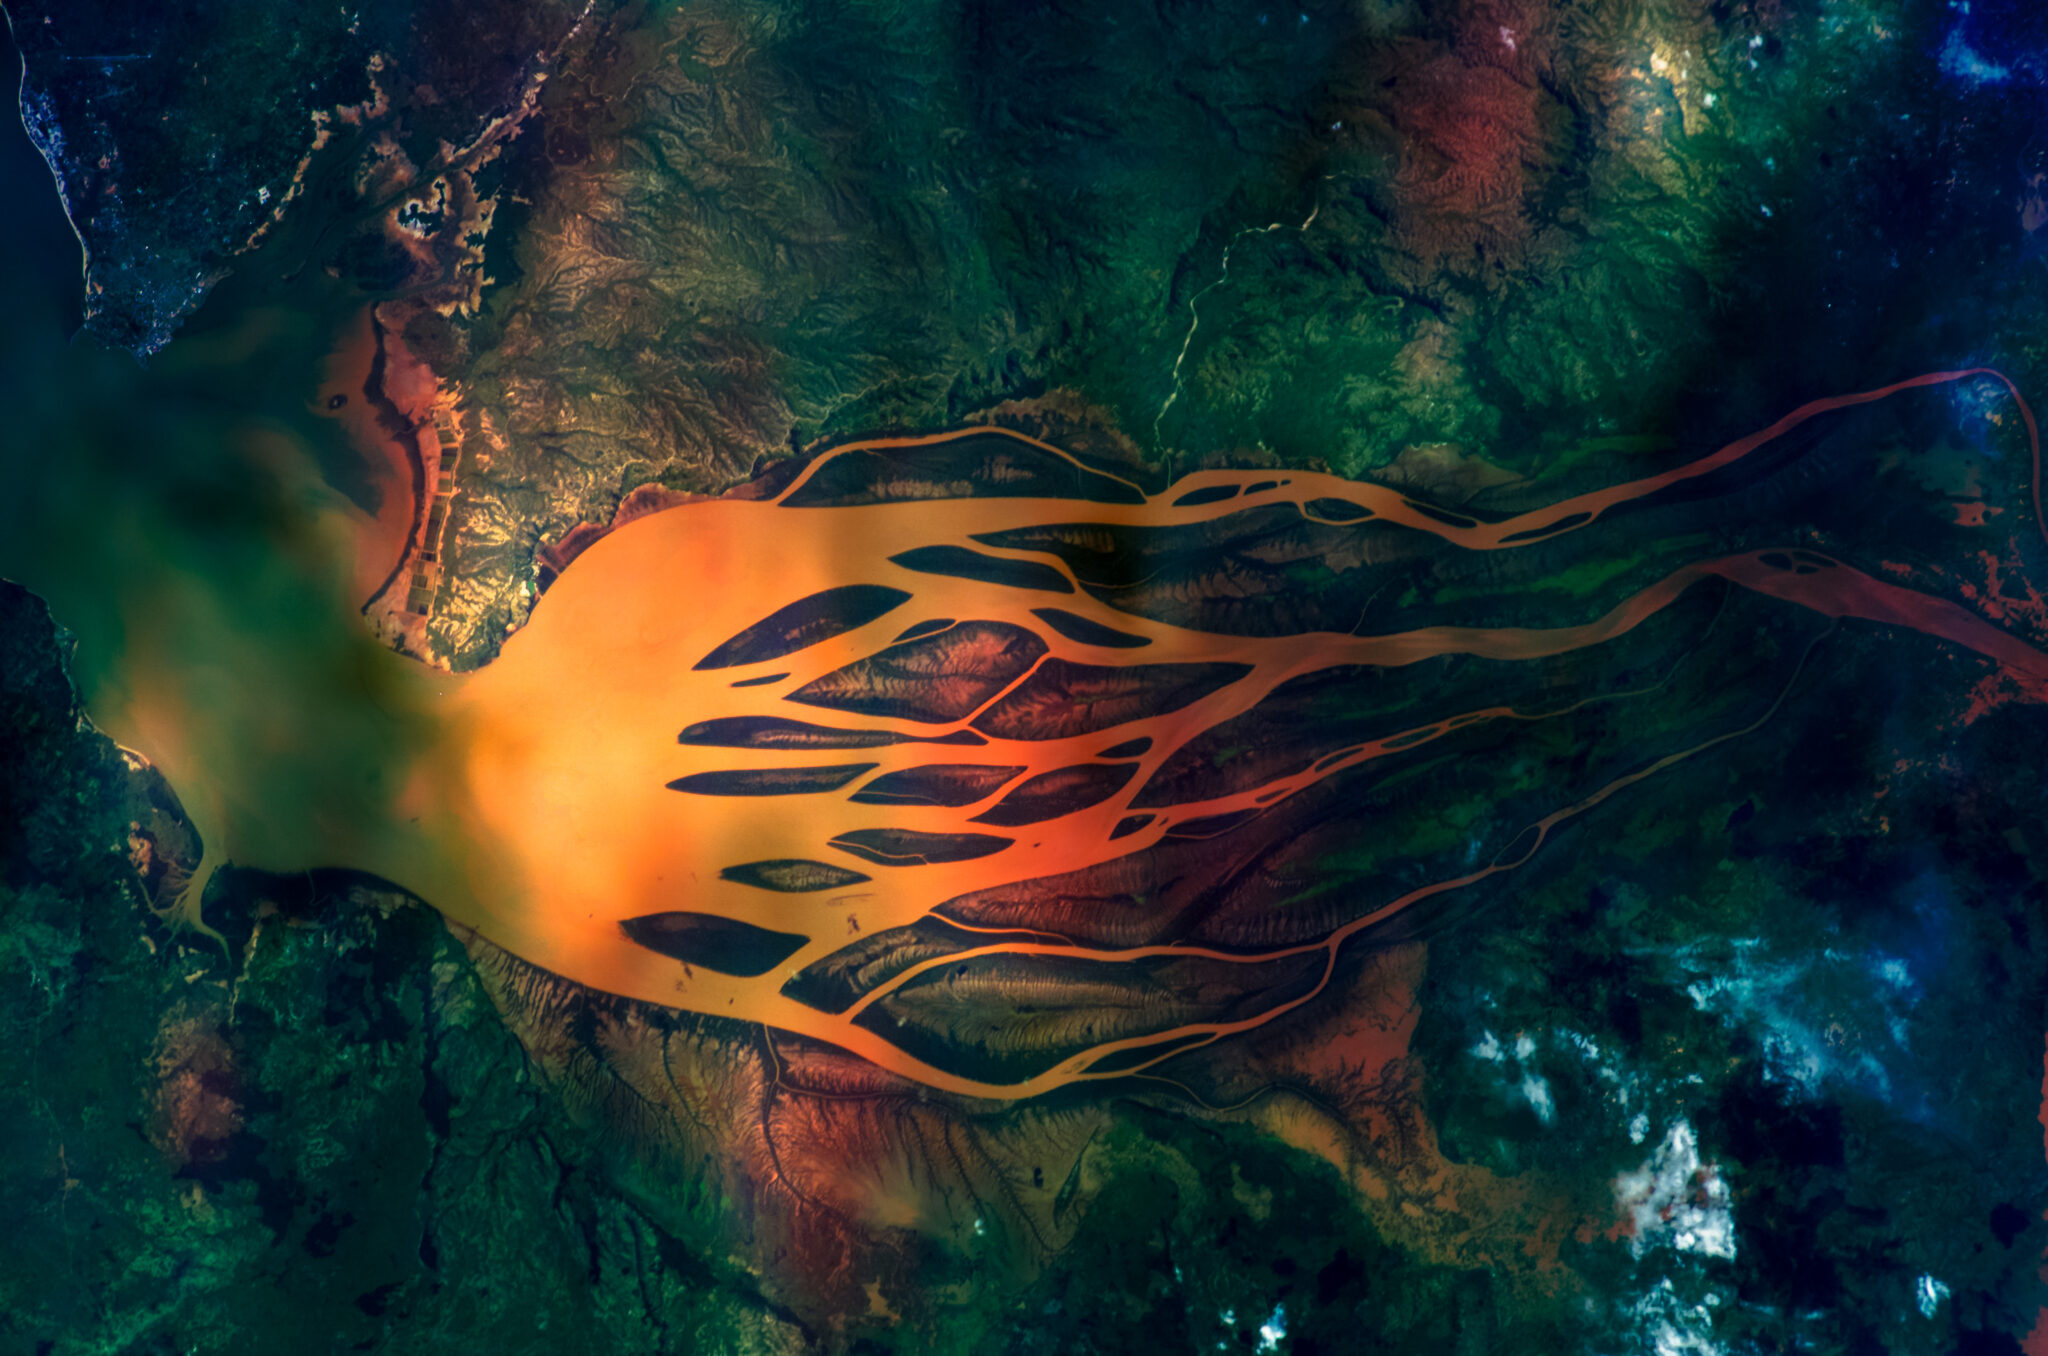
Satellite view of the Betsiboka River, Madagascar. Elements of this image furnished by NASA. © elen31 – stock.adobe.com
Policy Context
There are over 700 earth observation (EO) satellites in orbit around the earth generating massive amounts of imagery that—if used properly—can help inform and appraise policy-making around the world. Academic research has already shown the immense value of using satellite images with machine learning (SIML) to better understand forest cover, land use, poverty rates, and population density, among other outcomes. SIML has vast potential to improve the quality and frequency of information at decision-makers’ disposal, particularly in low- and middle-income countries (LMICs) where accurate and timely data is often difficult if not impossible to come by.
Study Design
To meet this need, a team of researchers at UC Santa Barbara and UC Berkeley have developed a simple tool called MOSAIKS (short for “Multi-Task Observation Using Satellites and Kitchen Sinks”) that transforms satellite imagery from almost anywhere on earth into summary information that can be used to predict a wide range of different outcomes (“tasks”) in a matter of minutes using a standard laptop computer. This means users can leverage imagery information to solve a variety of customized measurement challenges using basic statistics and a laptop, without ever needing to store or directly manipulate raw imagery.
MOSAIKS makes SIML much more computationally efficient by collecting and housing satellite imagery on servers in the United States, and employing an automated, centralized process to extract “features”— summary pieces of information indicating color, texture, and spatial structure. These features are then put into a regression model to predict the outcome of interest (“task”). Amazingly, this approach performs similarly to more computationally intense, decentralized, and technically demanding approaches that use convolutional neural networks (CNNs) (Rolf et al., 2021).
Results and Policy Lessons
MOSAIKS can help government partners fill critical data gaps by leveraging the high-resolution and comprehensive nature of satellite imagery. The measurements derived from MOSAIKS can also be coupled with quasi-experimental approaches to improve impact evaluation of policies and programs. Below we provide some examples of potential “tasks”:
- Food security: crop mapping and agricultural production prediction
- Housing: housing stock estimation and affordable housing development
- Illicit crops: detecting illicit crop cultivation
- Environmental protection: monitoring to mitigate deforestation, informal mining, and other resource extraction activities
- Many other social or environmental outcomes that are feasibly visible in satellite imagery
For any of these or other outcome variables, MOSAIKS can be used to increase the spatial coverage of existing survey data or to increase the spatial resolution of existing aggregate administrative data. For more information on how to use this tool and access the API, visit mosaiks.org or read this two-page concept note summarizing the tool and its potential application.


